 Social Media Marketing
Social Media Mistakes That Cost Reach
Nov 10, 2021
· 5 min read
Social media analytics tells you whether it is working. What to actually measure, how to read it while avoiding vanity metrics, and turning data into better social.
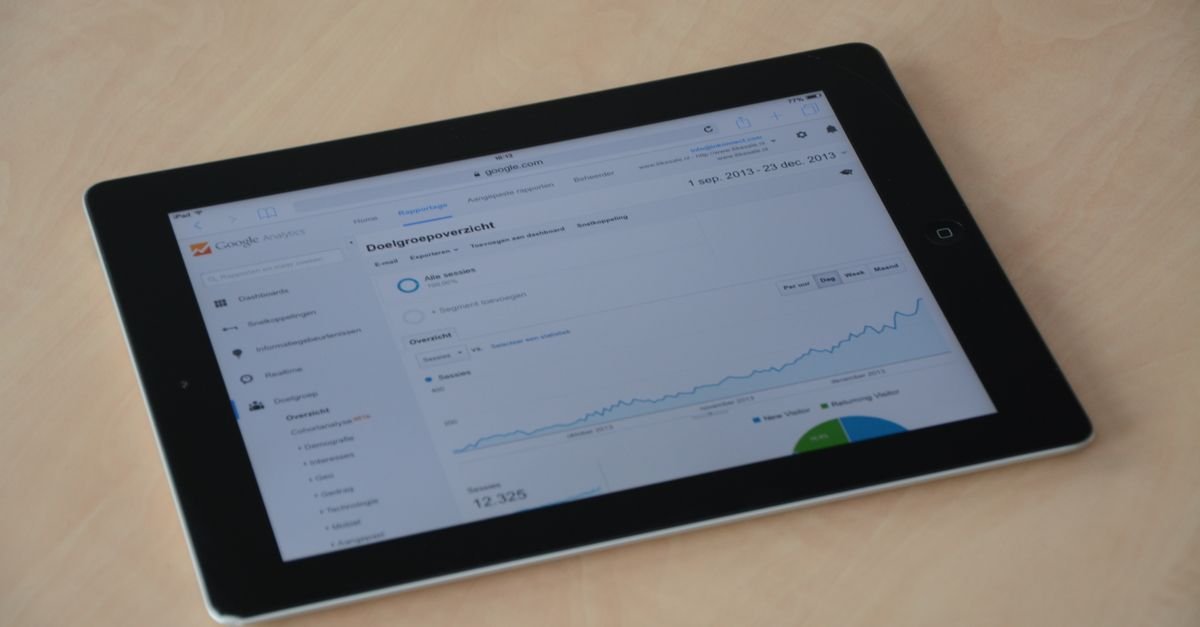
Social media analytics is where you find out whether all that posting, engaging and creating is actually working — or whether you're mistaking activity for results. Done well, analytics turns social media from a channel you hope is helping into one you can prove and improve. Done badly (chasing vanity metrics), it produces impressive-looking reports that mean nothing. Here's how to approach social media analytics: what to measure, how to read it, and how to turn data into better social media.
The metrics that matter, organised by what they tell you: reach and awareness (impressions, reach — how many people saw your content — useful for understanding visibility, but only a starting point, not an end); engagement (likes, comments, shares, saves — and crucially engagement rate, which normalises for audience size — telling you whether content resonates, with shares and saves being higher-value signals than likes); audience growth and quality (follower growth matters less than the quality and relevance of your audience — a smaller engaged audience beats a large disengaged one); traffic driven (clicks and traffic to your site — where social starts connecting to business outcomes, tracked via analytics and UTM tagging); conversions and outcomes (the metrics closest to business results — leads, sales, sign-ups attributed to social — what social is ultimately for); and content performance (which posts, formats and topics perform, so you can do more of what works). The hierarchy matters: reach and engagement are means, traffic and conversions are ends — measure both, but judge success by the outcomes, per the KPI discipline.
The discipline that separates useful analytics from impressive-but-meaningless reports: beware vanity metrics (follower count, raw likes, and impressions look impressive but often don't connect to business results — the classic social vanity trap; a big following that doesn't engage or convert is a vanity number, so don't optimise for the metrics that flatter rather than inform); engagement rate over raw counts (engagement rate tells you if content resonates, normalised for size — far more useful than raw likes on a big account); tie back to outcomes (the ultimate question isn't "good engagement?" but "is social driving traffic, leads, and business?" — connect social metrics to results); read trends, not single posts (one post is noise; patterns over time are signal); segment by content type and platform (aggregate numbers hide what's really working — analyse by format, topic and platform to learn); compare like-for-like (against your own past performance and relevant benchmarks, not generic averages); and connect the funnel (understand how social reach → engagement → traffic → conversion flows, so you see social's real contribution, aided by fair attribution). Read for outcomes and patterns, resist the vanity metrics, and analytics becomes genuinely useful.
The practices that make analytics improve your results: learn what works and do more of it (the core value — identify your best-performing content, formats and topics, and make more of that, per the strategy feedback loop); identify and cut what doesn't (stop pouring effort into content and platforms that don't perform); test and iterate (use analytics to test approaches and refine — the continuous improvement that compounds over time); inform strategy decisions (let data guide platform choice, content direction, and resource allocation — including confirming or challenging your platform choices); use the right tools (native platform analytics for each channel, plus cross-platform dashboards or dedicated tools for a unified view, often via scheduling/management tools that bundle analytics); report on outcomes (when reporting to stakeholders, lead with business outcomes and insight, not vanity metrics — the KPI-focused reporting); and close the loop with listening (combine hard analytics with social listening for the full picture — the numbers and the why). Analytics used this way turns social from guesswork into a measured, improving channel — proving and growing the results your content and authority drive (our half).
Track a hierarchy: reach/impressions (visibility — a starting point), engagement (especially engagement rate, plus high-value signals like shares and saves — does content resonate?), audience quality (more than raw follower count), traffic driven to your site, and — most importantly — conversions and outcomes (leads, sales attributed to social — what it's ultimately for). Reach and engagement are means; traffic and conversions are ends. Measure both but judge success by outcomes, per the KPI discipline.
Metrics that look impressive but don't connect to business results — raw follower count, total likes, and impressions in isolation. They flatter (a big number feels like success) but say nothing about whether social drives traffic, leads or business. A large following that doesn't engage or convert is a vanity number. Focus instead on engagement rate (which shows resonance) and outcomes (traffic, conversions) — judging social by results rather than the metrics that flatter, per the outcome discipline.
Identify what works (your best-performing content, formats, topics, and platforms) and do more of it; cut what doesn't perform; test and iterate to refine; and let data inform strategy decisions (platform choice, content direction, resource allocation). Use native platform analytics plus cross-platform tools for a unified view, read trends and outcomes (not vanity metrics or single posts), and combine the numbers with social listening for the full picture. This turns analytics into a feedback loop that continuously improves the results your content and authority drive (our lane).
Every site on BacklinksMedia is verified, priced upfront and ready to order.
Growth engineer at BacklinksMedia, working on outreach analytics and the verified link marketplace.
Social Media Marketing
 Social Media Marketing
 Social Media Marketing