 Conversion Rate Optimisation
Building a CRO Testing Roadmap
Jun 04, 2021
· 4 min read
CRO's eyes: what heatmaps and recordings show, how to use them as research not entertainment, and the limits that mean they don't replace testing.
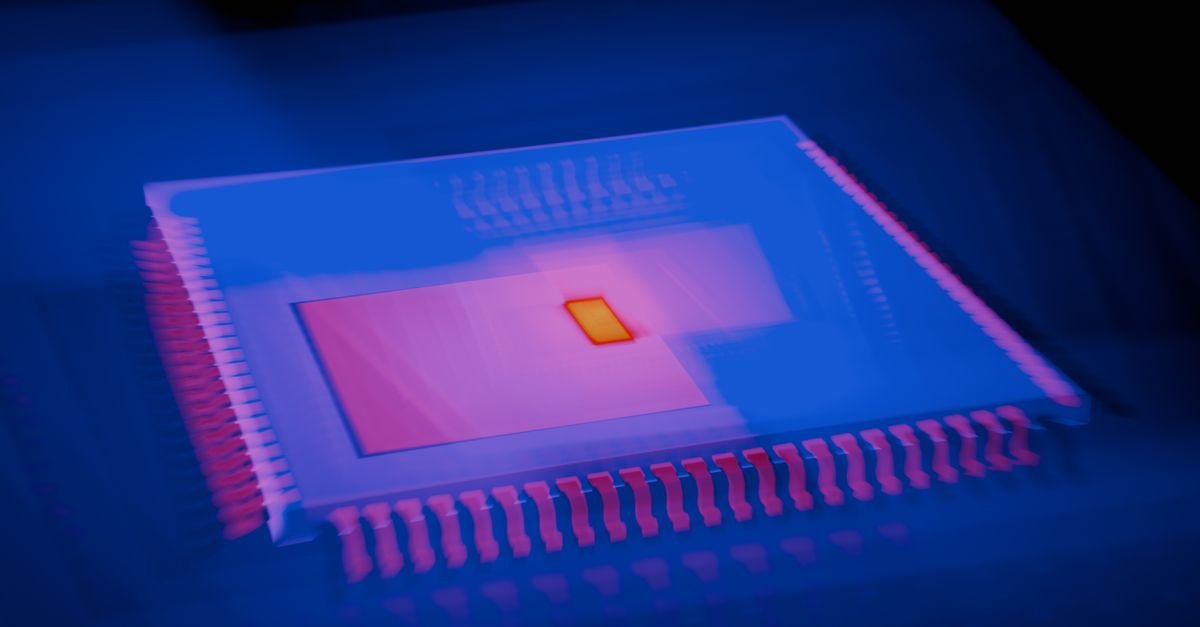
Heatmaps and session recordings are CRO's eyes — the tools that show you what visitors actually do on your pages, versus what your analytics numbers say happened without the why. They're where the qualitative "why aren't they converting?" gets answered: the rage-clicks on a non-button, the scroll that stops before the CTA, the form field where everyone gives up. Used well they generate the hypotheses testing then proves; used badly they're a fascinating time-sink. Here's what they show, how to use them, and their limits.
Heatmaps aggregate visitor behaviour visually: click maps (where people click — revealing the non-clickable elements they expect to click, and whether your CTA gets the clicks), scroll maps (how far down people read — showing if your key content/CTA is below where most stop scrolling), and move/attention maps (where attention goes). They answer "what are visitors doing in aggregate on this page?" — surfacing the patterns (the ignored CTA, the false-affordance click, the content nobody scrolls to). Session recordings play back individual visits: the actual mouse movement, clicks, scrolls and hesitations of real sessions — answering "what's this specific visitor's experience?" and catching the things aggregates miss (the confusion, the rage-click, the abandonment moment). Together: heatmaps for the aggregate patterns, recordings for the individual why.
The productive use, per the CRO research discipline: investigate specific questions (not browse aimlessly — "why does this page convert poorly?" → watch its heatmap and recordings for the leak, versus watching recordings for fun, which is fascinating and useless); look for the friction and confusion signals (rage-clicks, dead clicks on non-buttons, scroll-stops before key content, form fields where sessions end, the hesitation-and-leave patterns — the diagnostic gold); generate hypotheses (the heatmap shows the CTA gets no clicks → hypothesis: it's not prominent/clear enough → the test to prove it); and combine with quantitative data (the analytics say where visitors drop, the heatmaps/recordings say why — the qual-plus-quant pairing that locates and explains the leak). The tools are hypothesis-generators feeding the testing pipeline, not conclusions themselves.
The critical caveat: heatmaps and recordings show behaviour, not causation or solutions — they reveal that visitors ignore the CTA, not why-conclusively or what-fixes-it (those are hypotheses to test). The mistakes: treating observations as conclusions (watching a few recordings and "knowing" the fix — small qualitative samples are suggestive, not proof, and the fix still needs testing where traffic allows); the sample-size trap (a handful of recordings isn't representative — patterns across many are the signal, not one dramatic session); and the time-sink (recordings are engrossing and can eat hours for little insight if not question-driven). Used right — question-driven, pattern-focused, feeding hypotheses to testing — they're among CRO's most valuable research tools; used as entertainment or as conclusions, they mislead. The eyes that show you the leak, not the proof of the fix — which is testing's job, on traffic content and authority earned.
Yes — they're among the most accessible CRO research, valuable even at traffic too low for A/B testing (where you can't test, watching real behaviour to diagnose and then ship evidence-backed fixes is the CRO path — the qualitative approach). Small sites often get more from qualitative tools than from under-powered testing.
Enough to see patterns, not one dramatic session — a handful is suggestive, patterns across many are the signal (and the honest note that even many recordings are qualitative, so findings are hypotheses to test where possible, not conclusions). Watch question-driven (investigating a specific leak), stop when the pattern's clear, and resist the engrossing time-sink of aimless watching.
They tell you what's happening (the ignored CTA, the scroll-stop, the rage-click), which generates the hypothesis for the fix — but the fix itself still needs testing to prove, because behaviour-observation isn't causation-or-solution. Heatmaps are the eyes that find the leak; testing is the proof of the fix — both serving conversion on traffic earned via content and authority (our lane).
Every site on BacklinksMedia is verified, priced upfront and ready to order.
Growth engineer at BacklinksMedia, working on outreach analytics and the verified link marketplace.
Conversion Rate Optimisation
 Conversion Rate Optimisation
 Conversion Rate Optimisation